Track participant progress with reports
Track participant progress with reports
The Reports section in your Admin Area gives you a full picture of how participants engage with your programs — from activity completion and event attendance to appointment bookings.
Who can see reports
What you can see depends on your role:
| Role | Reports | Space Reports | Client Reports |
|---|---|---|---|
| Owner / Admin / Implementation Admin | All | All | All |
| Program Admin | — | For programs you run | For participants in programs you share |
| Program Facilitator | — | For programs you facilitate | For participants in programs you share |
| Program Sponsor | — | For programs you sponsor | For participants in programs you sponsor |
| Participant | — | — | — |
A Program Admin or Facilitator can open a Client Report for a participant only if the two of them share at least one space where the Program Admin or Facilitator has report access. Trying to open a Client Report for someone you don’t share a space with returns 403 — even from a direct link.
Owners and Admins have the organization-wide shortcut and can see every participant’s report.
About the labels. You’ll see “Client Reports” and “Active Clients” in the Reports UI even though the rest of the product now says “Participant”. These labels haven’t been renamed yet — they refer to the same thing.
Open reports
Open Admin Area from the sidebar, then click Reports. You’ll see three sections (visible based on your role):
- Reports — Organization-wide membership and activity trends. Owners and Admins only.
- Space Reports — Progress data for a specific program.
- Client Reports — One participant’s activity across all programs you share with them.
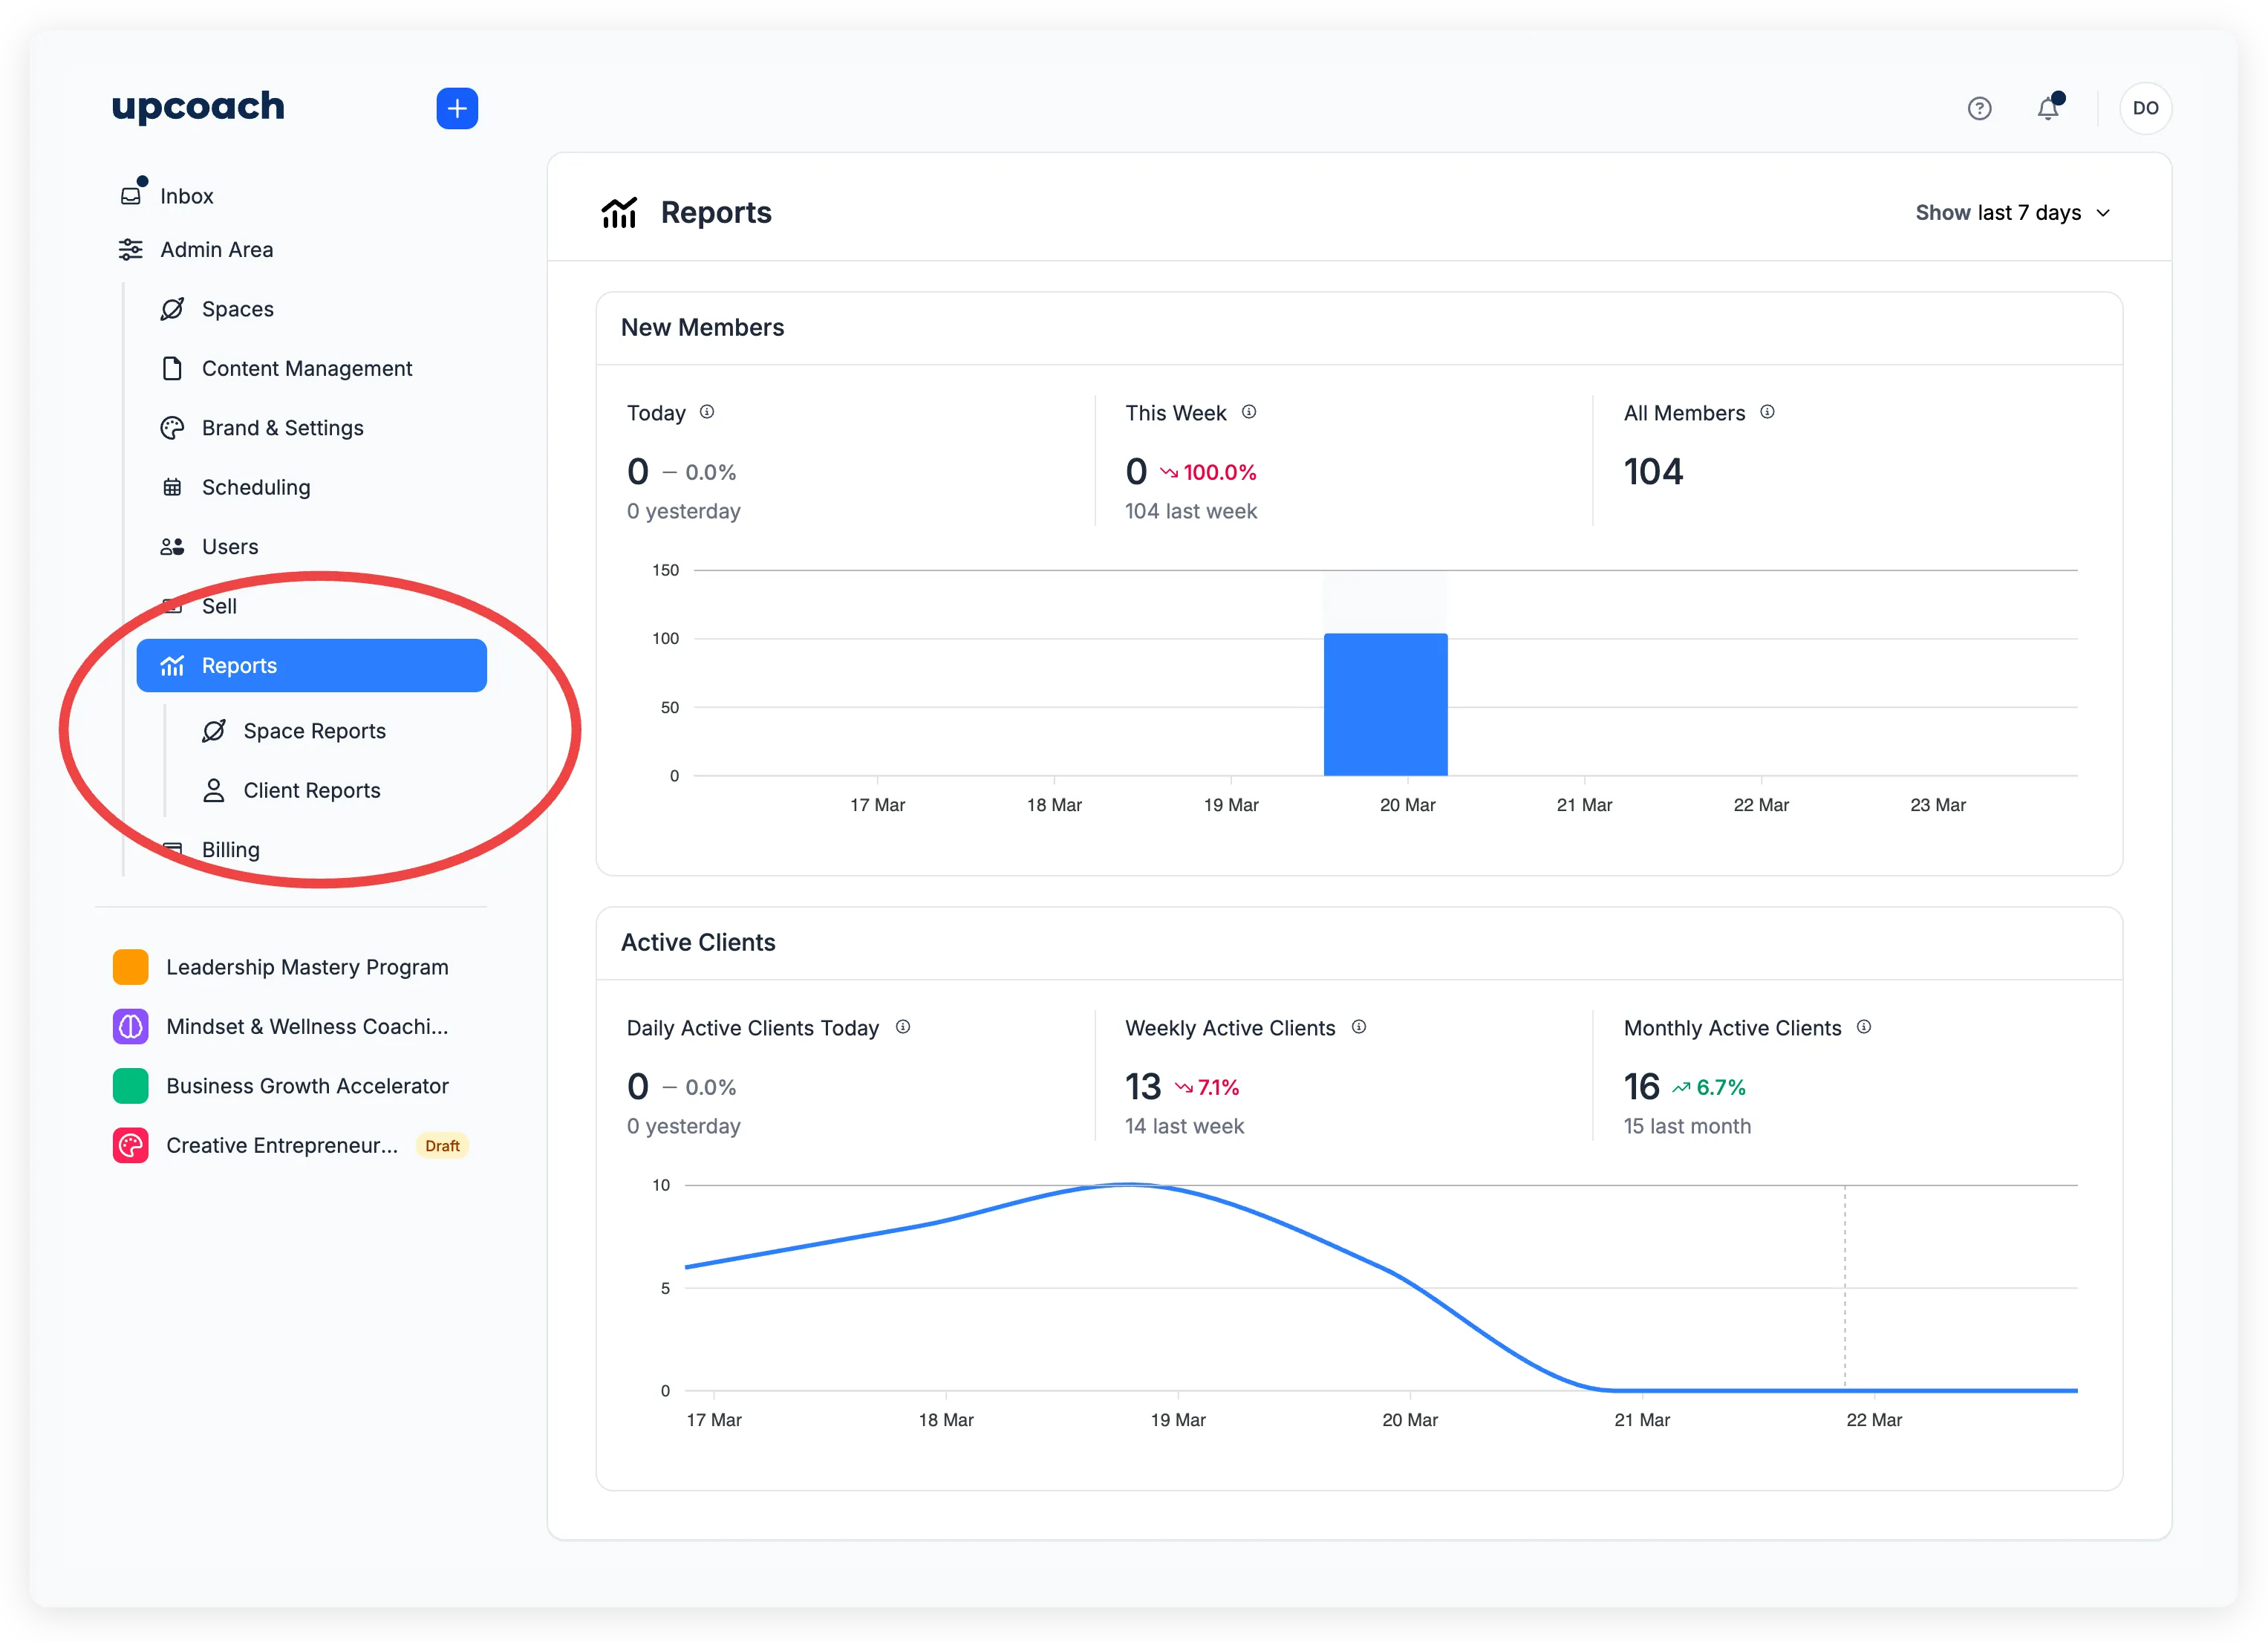
Organization reports
The main Reports page shows membership growth and participant activity across your entire organization.
New Members
Tracks how many new members joined your organization:
| Stat | What it shows |
|---|---|
| Today | New members today, compared to yesterday |
| This Week | New members since Monday, compared to last week |
| All Members | Total member count (excluding deleted accounts) |
A bar chart below shows daily new member counts for the selected date range. Use the Show dropdown to switch between Last 7 Days, Last 30 Days, Last 3 months, or Last year.
Active Clients
Shows how many unique participants had at least one session:
| Stat | What it shows |
|---|---|
| Daily Active Clients Today | Unique participants with a session today |
| Weekly Active Clients | Unique participants in the last 7 days |
| Monthly Active Clients | Unique participants in the last 30 days |
Each stat includes a comparison to the previous period. A line chart below shows the daily trend.
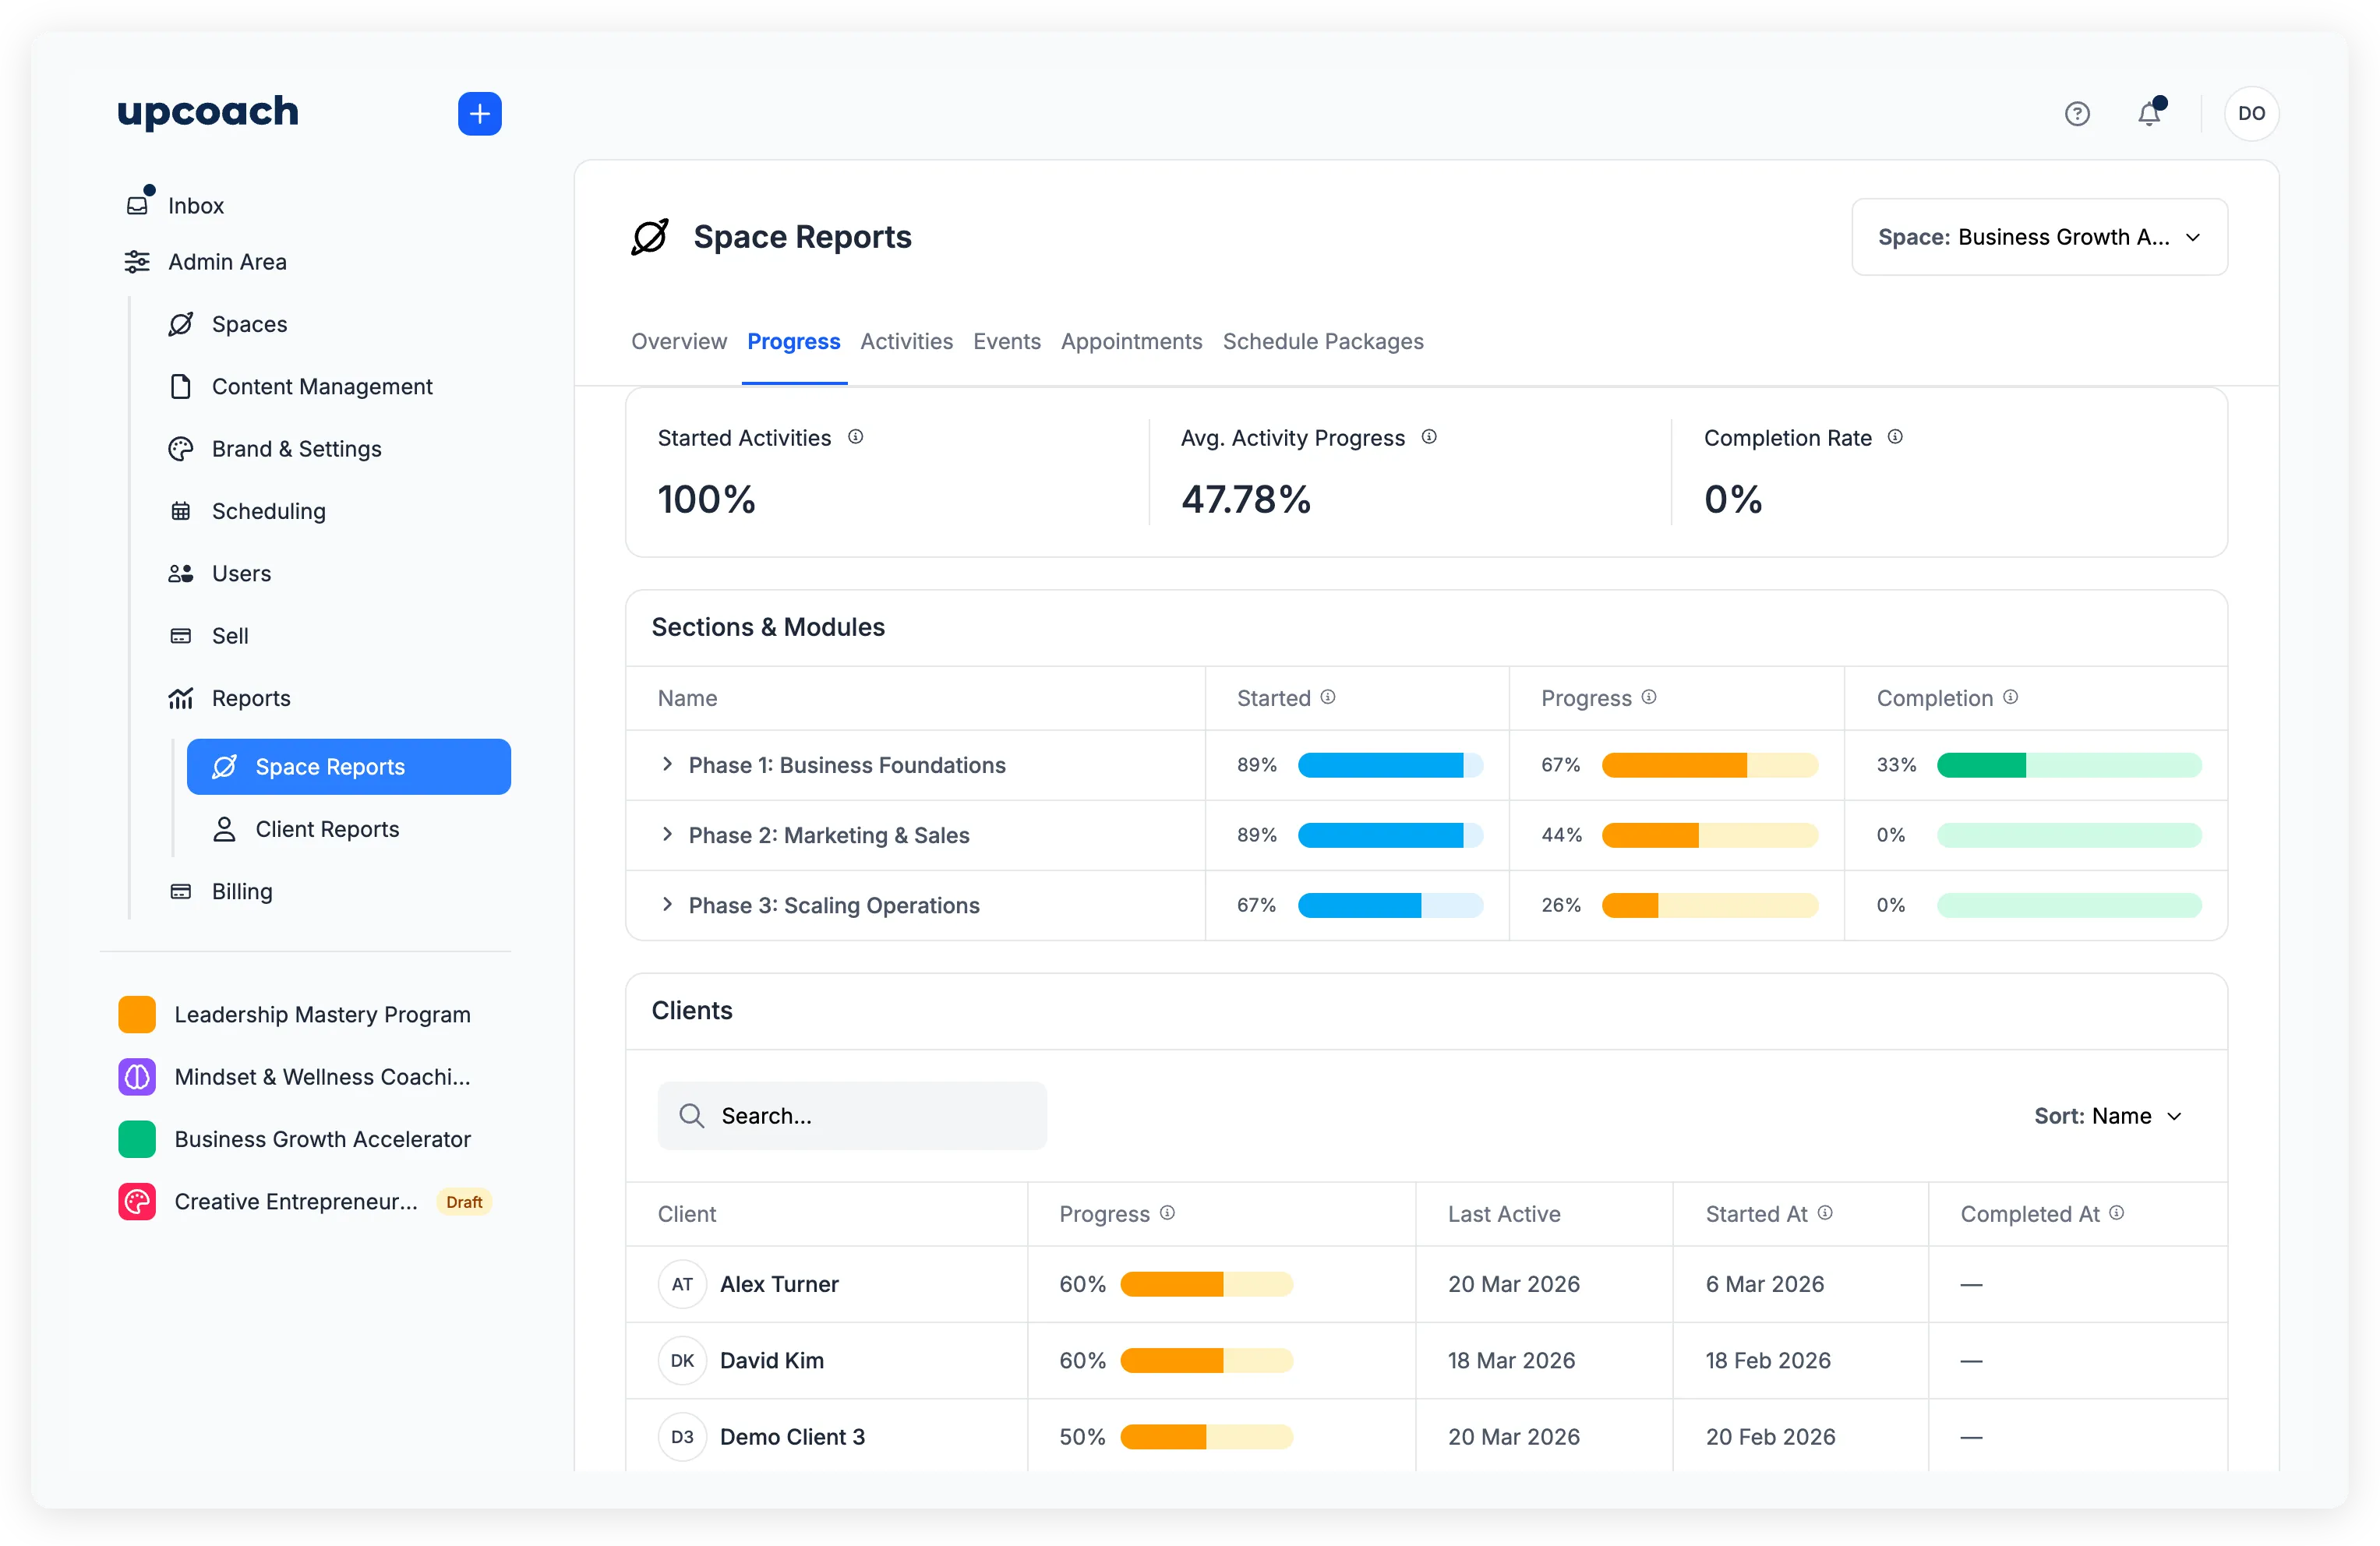
Space reports
Space reports let you drill into a single program. Select a space from the dropdown at the top of the page to see its data. There are six tabs.
Overview tab
Shows top-level stats for the selected space:
- Members — Participants enrolled in the space
- Active Clients — Participants with a session in the last 30 days
- Sections — Total sections in the space
- Modules — Total modules across all sections
- Completion Rate — Percentage of members who finished every activity
An Active Clients line chart shows participant activity over the selected date range.
Progress tab
Breaks down how participants move through your curriculum.
Summary stats:
- Started Activities — Percentage of members who completed at least one activity
- Avg. Activity Progress — Average completion across all members and sections
- Completion Rate — Percentage of members at 100% completion
Sections & Modules shows each section with progress bars for Started, Progress, and Completion. Click a section name to expand it and see a bar chart of completion rates per module.
The Clients table lists every participant with their overall progress percentage, last active date, and when they started and completed the space. Sort by Name, Progress, Last Active, Started At, or Completed At.
Activities tab
The Activity Engagement table lists every activity in the space with its type, label, completion rate, view count, and location (section and module).
Filter by activity type or label, and sort by Name, Completion Rate, or Views.
Events tab
Shows event participation data for the selected space.
Overview stats:
- Events Created — Number of events (recurring events counted per occurrence)
- RSVP Rate — Percentage of members who responded “Attend”
- Attendance Rate — Percentage of members who actually attended
Feedback averages appear when events have feedback enabled: Value, Guidance, Content, and Engagement (each rated on a star scale).
The Attendance & Responses table lists each event with host, label, number of responses, and attendance count. Filter by host, label, or status (upcoming/past).
Appointments tab
Tracks one-on-one booking usage in the space.
Overview stats:
- Remaining Slots — Unbooked slots out of total available
- Book Rate — Percentage of slots that have been booked
- Attendance Rate — Percentage of booked appointments where the participant attended
Feedback averages work the same as events: Value, Guidance, Content, and Engagement.
The Booked Appointments table shows each appointment with its schedule package, host, participant, and attendance status. Filter by host, participant, package, attendance, or status. Click a package name to see its details.
Schedule Packages tab
Shows usage data across all schedule packages in the space.
Overview stats:
- Usage — Booked slots out of total available slots
- Attended / Booked — Attended appointments out of booked appointments
- Total Usage Rate — Percentage of all slots where the participant attended
The Packages table lists each package with its host, schedule name, expiration date, usage count, usage percentage, and remaining slots. Expired packages are marked in red. Filter by host or availability (expired/available), and sort by creation date.
Client reports
Client reports show one participant’s engagement across all your programs. Select a participant from the dropdown at the top of the page. There are four tabs.
Overview tab
Top-level stats for the selected participant:
- Spaces Enrolled — Number of programs they belong to
- Total Events Attended — Events attended (recurring counted per occurrence)
- Total Appointments Attended — Appointments attended
- Total Time Spent on Activities — Cumulative time across all sessions
The Spaces Enrolled table shows each program with enrollment date, progress percentage, last active date, and time spent.
A Time Spent chart shows how much time the participant has spent over the selected date range.
Activities tab
Shows activity-level detail for the selected participant.
Summary stats:
- Total Activities Viewed — Activities viewed out of total available
- Total Activities Completed — Activities completed out of total available
- Total Worksheets Completed — Worksheets completed out of total available
- Total Tasks Completed — Tasks completed (only appears when the participant has task list data)
The Activity Engagement table lists each activity with its type, label, whether it was viewed, completion date, and location (space, section, module). Filter by type, label, or status (viewed, completed).
Events tab
Shows the participant’s event history across all spaces.
Overview stats:
- Total Events Attended — Events this participant attended
- RSVP Rate — Percentage of available events they responded “Attend” to
- Attendance Rate — Percentage of available events they actually attended
Feedback averages for this participant: Value, Guidance, Content, and Engagement.
The Events table shows each event with host, label, status, whether they responded, attended, watched the recording (as a percentage), and whether they submitted feedback. Filter by label, status, attended, or feedback submitted.
Appointments tab
Shows the participant’s appointment bookings.
Overview stats:
- Remaining Slots — Unbooked slots available to this participant
- Book Rate — Percentage of available slots they booked
- Attendance Rate — Percentage of booked appointments they attended
Feedback averages for this participant: Value, Guidance, Content, and Engagement.
The Appointments table shows each appointment with host, package, status, attendance, recording watched, and feedback submitted. Filter by host, package, status, or attended.