


Use worksheets to create interactive exercises
Use worksheets to create interactive exercises
Worksheets are activities where participants respond to structured questions — from simple text prompts to visual tools like wheels and canvases. Each participant completes the worksheet once, and you can review their responses individually or see aggregated results across the group.
Before you begin
- You need a program with the Coaching & Learning app installed
- You need at least one section and one module in your curriculum (see Build your curriculum)
Question types
Worksheets support eight question types plus a content block for adding context between questions:
| Question type | What it does | Best for |
|---|---|---|
| Open ended | Free-text response | Reflections, written exercises, detailed feedback |
| Single select | Choose one option from a list | Decision-making, preference questions, categorization |
| Multiple select | Choose one or more options from a list | Multi-topic selections, self-assessments |
| Linear scale | Pick a number on a labeled scale | Ratings, confidence levels, satisfaction scores |
| Ranking | Drag items to rank by importance | Prioritization exercises, values sorting |
| Wheel | Rate categories on a 1–10 scale displayed as a visual chart | Life balance assessments, multi-area evaluations |
| Canvas | Fill in cells of a structured grid | Frameworks, matrices, planning templates |
| Signature | Draw or add a signature | Agreements, commitments, sign-offs |
You can also add Content / Media blocks between questions. These are not questions — they display rich text, images, video, or embeds to provide instructions or context.
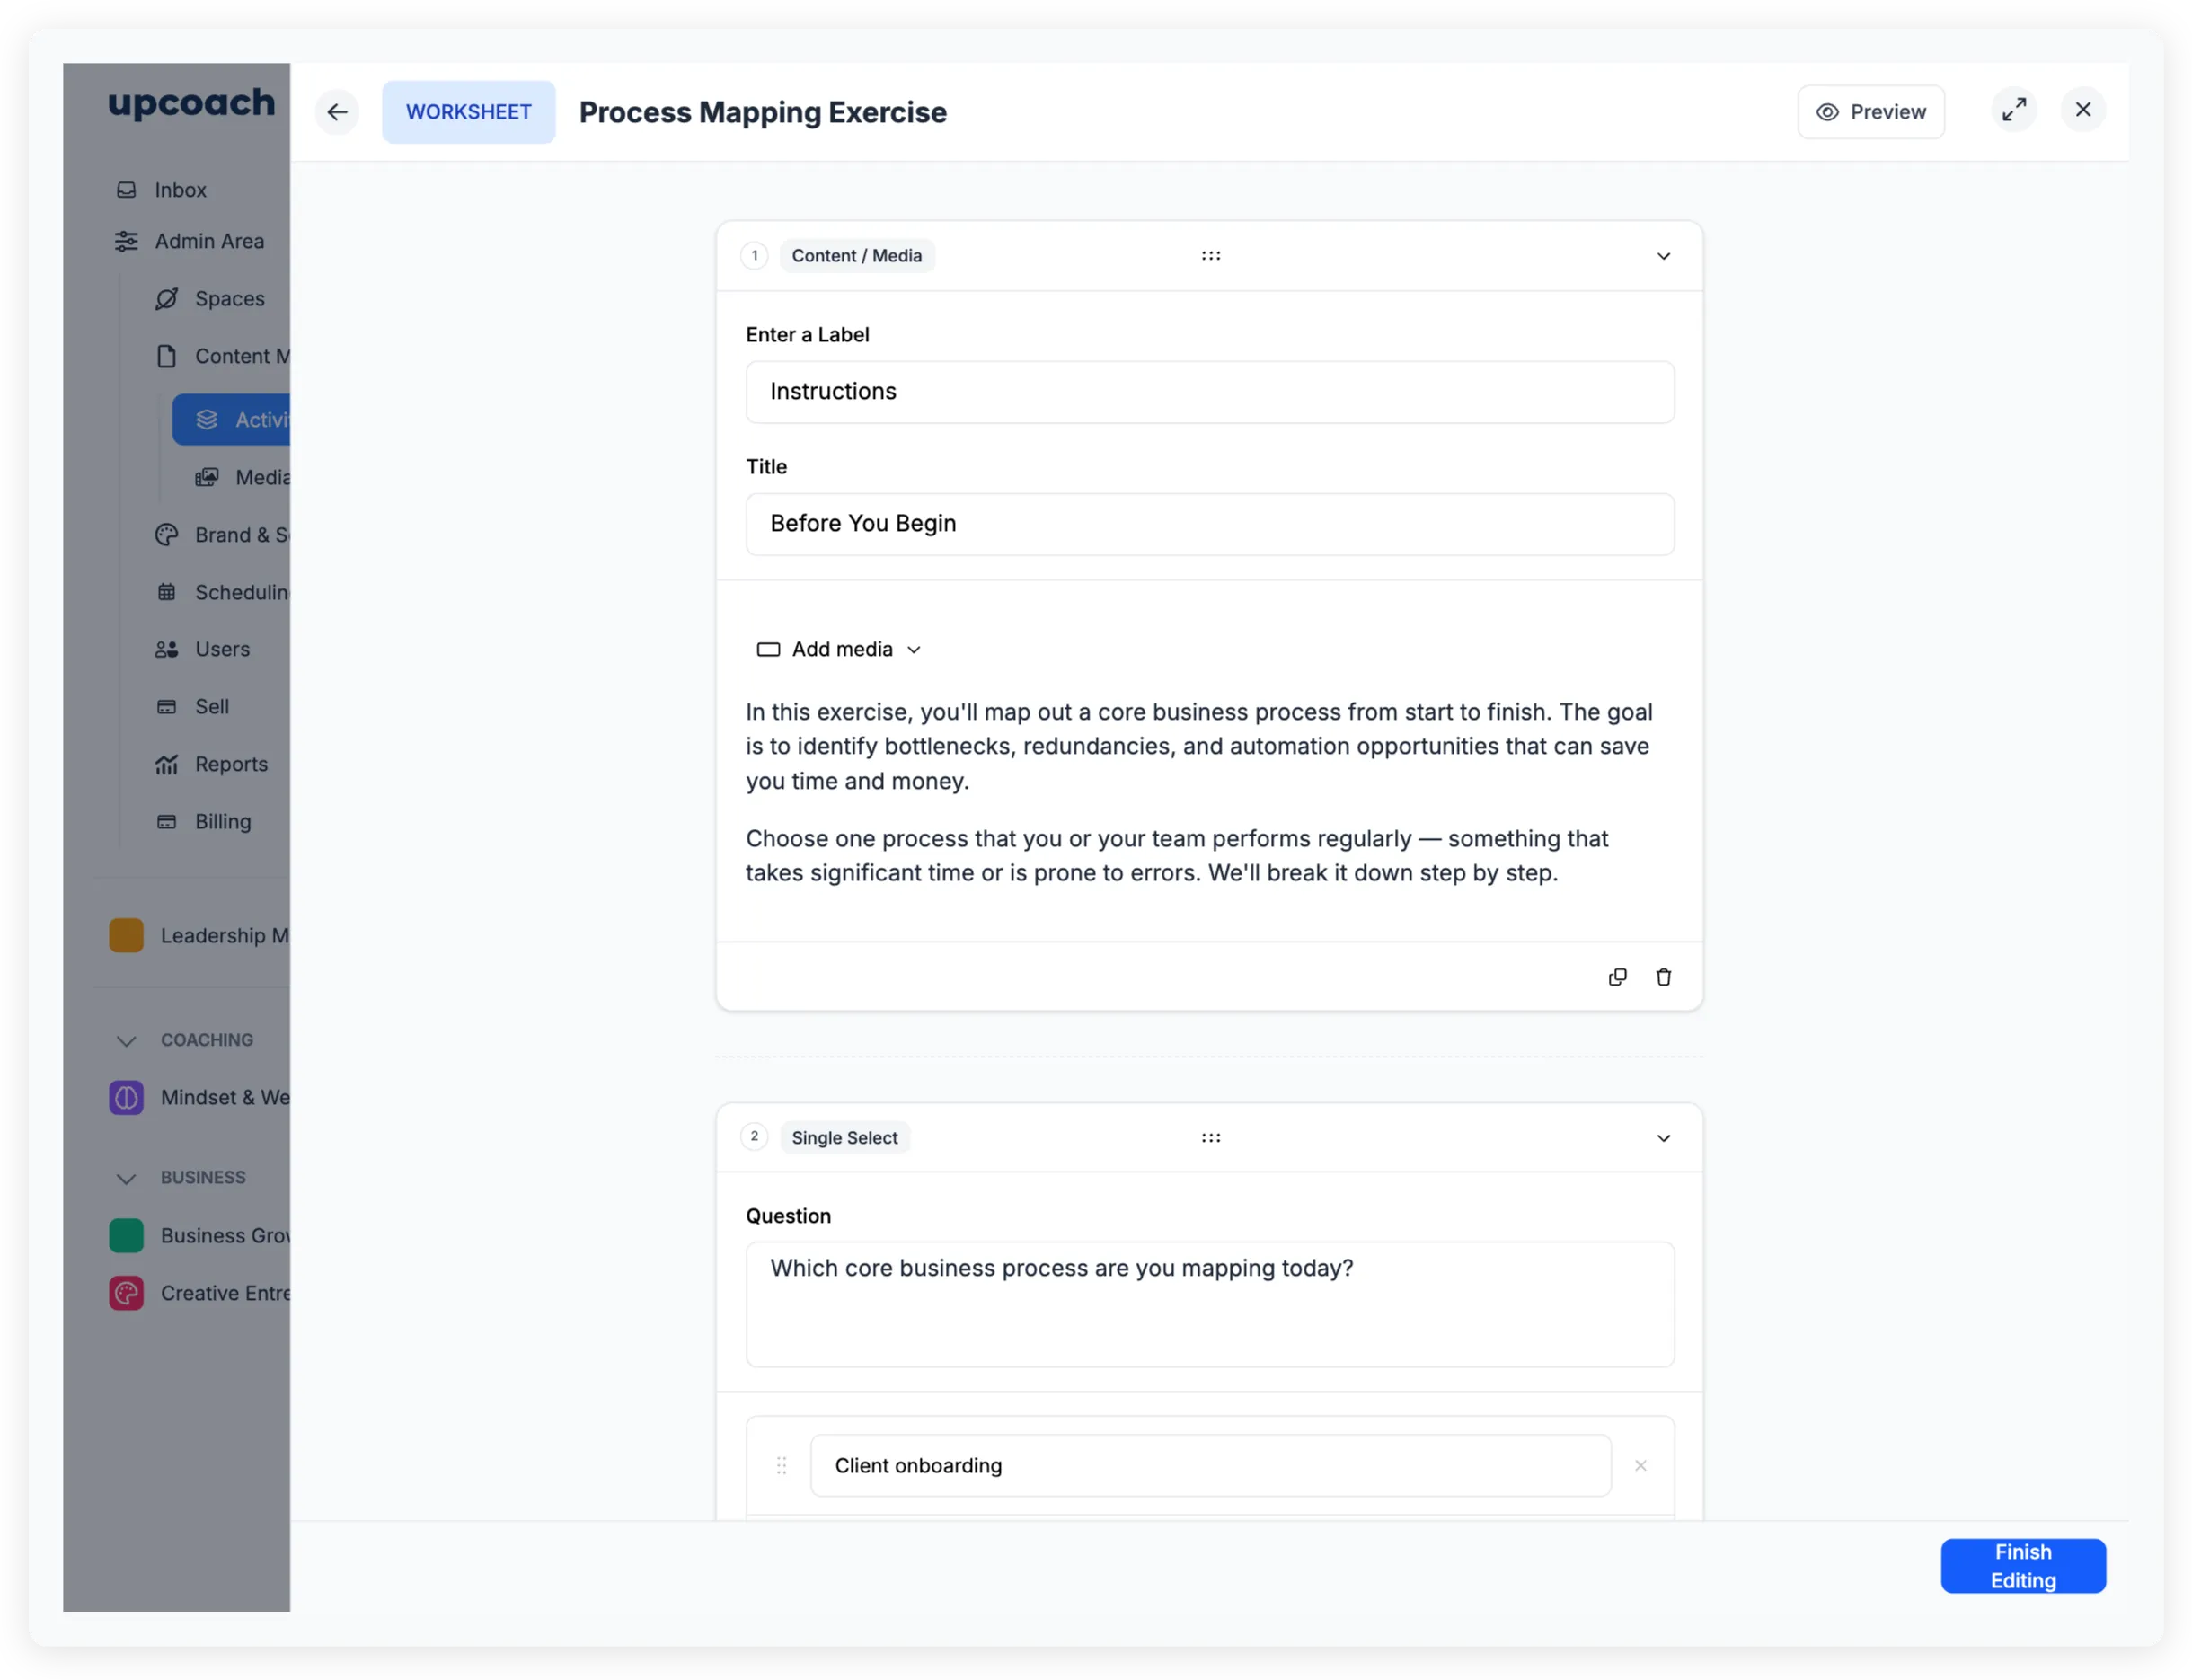
Create a worksheet
- Open your program and click the section where you want to add the worksheet.
- Inside a module, click the add button to open the activity library.
- Select Worksheet as the activity type.
- Click Add Question to open the question type picker, then select a type.
- Write your question in the editor field.
- For select and ranking questions, add the options participants will choose from. Click Add option for each additional choice.
- Add more questions or content blocks as needed.
- Drag items by the grip handle to reorder them.
- Click Finish Editing when you’re done.
Setting up specific question types
Linear scale — Pick a preset (5 point scale, 7 point scale, 10 point scale) or select Custom to define your own. Label each point on the scale. You can have up to 15 points, and scales need at least 2.
Wheel — Comes with default categories (Career, Finance, Health, Personal Growth, Fun, Environment, Relationships, Romance), each with a pre-written question. Edit category names, colors, and questions to fit your program. You can have between 6 and 12 categories. Set the min and max labels for the 1–10 scale (e.g., “Strongly Disagree” to “Strongly Agree”).
Canvas — Pick a grid size from the presets (2×2, 2×3, 3×2, 3×3, or expand More for additional sizes). Label the rows and columns, give each cell a title, and optionally set placeholder text and a background color. Participants fill each cell with rich text.
Content / Media — Add an informational block between questions. Give it a short label (e.g., “INSIGHT”, “RESOURCE”, “WATCH & REFLECT”), a title, and add text, images, video, or embeds.
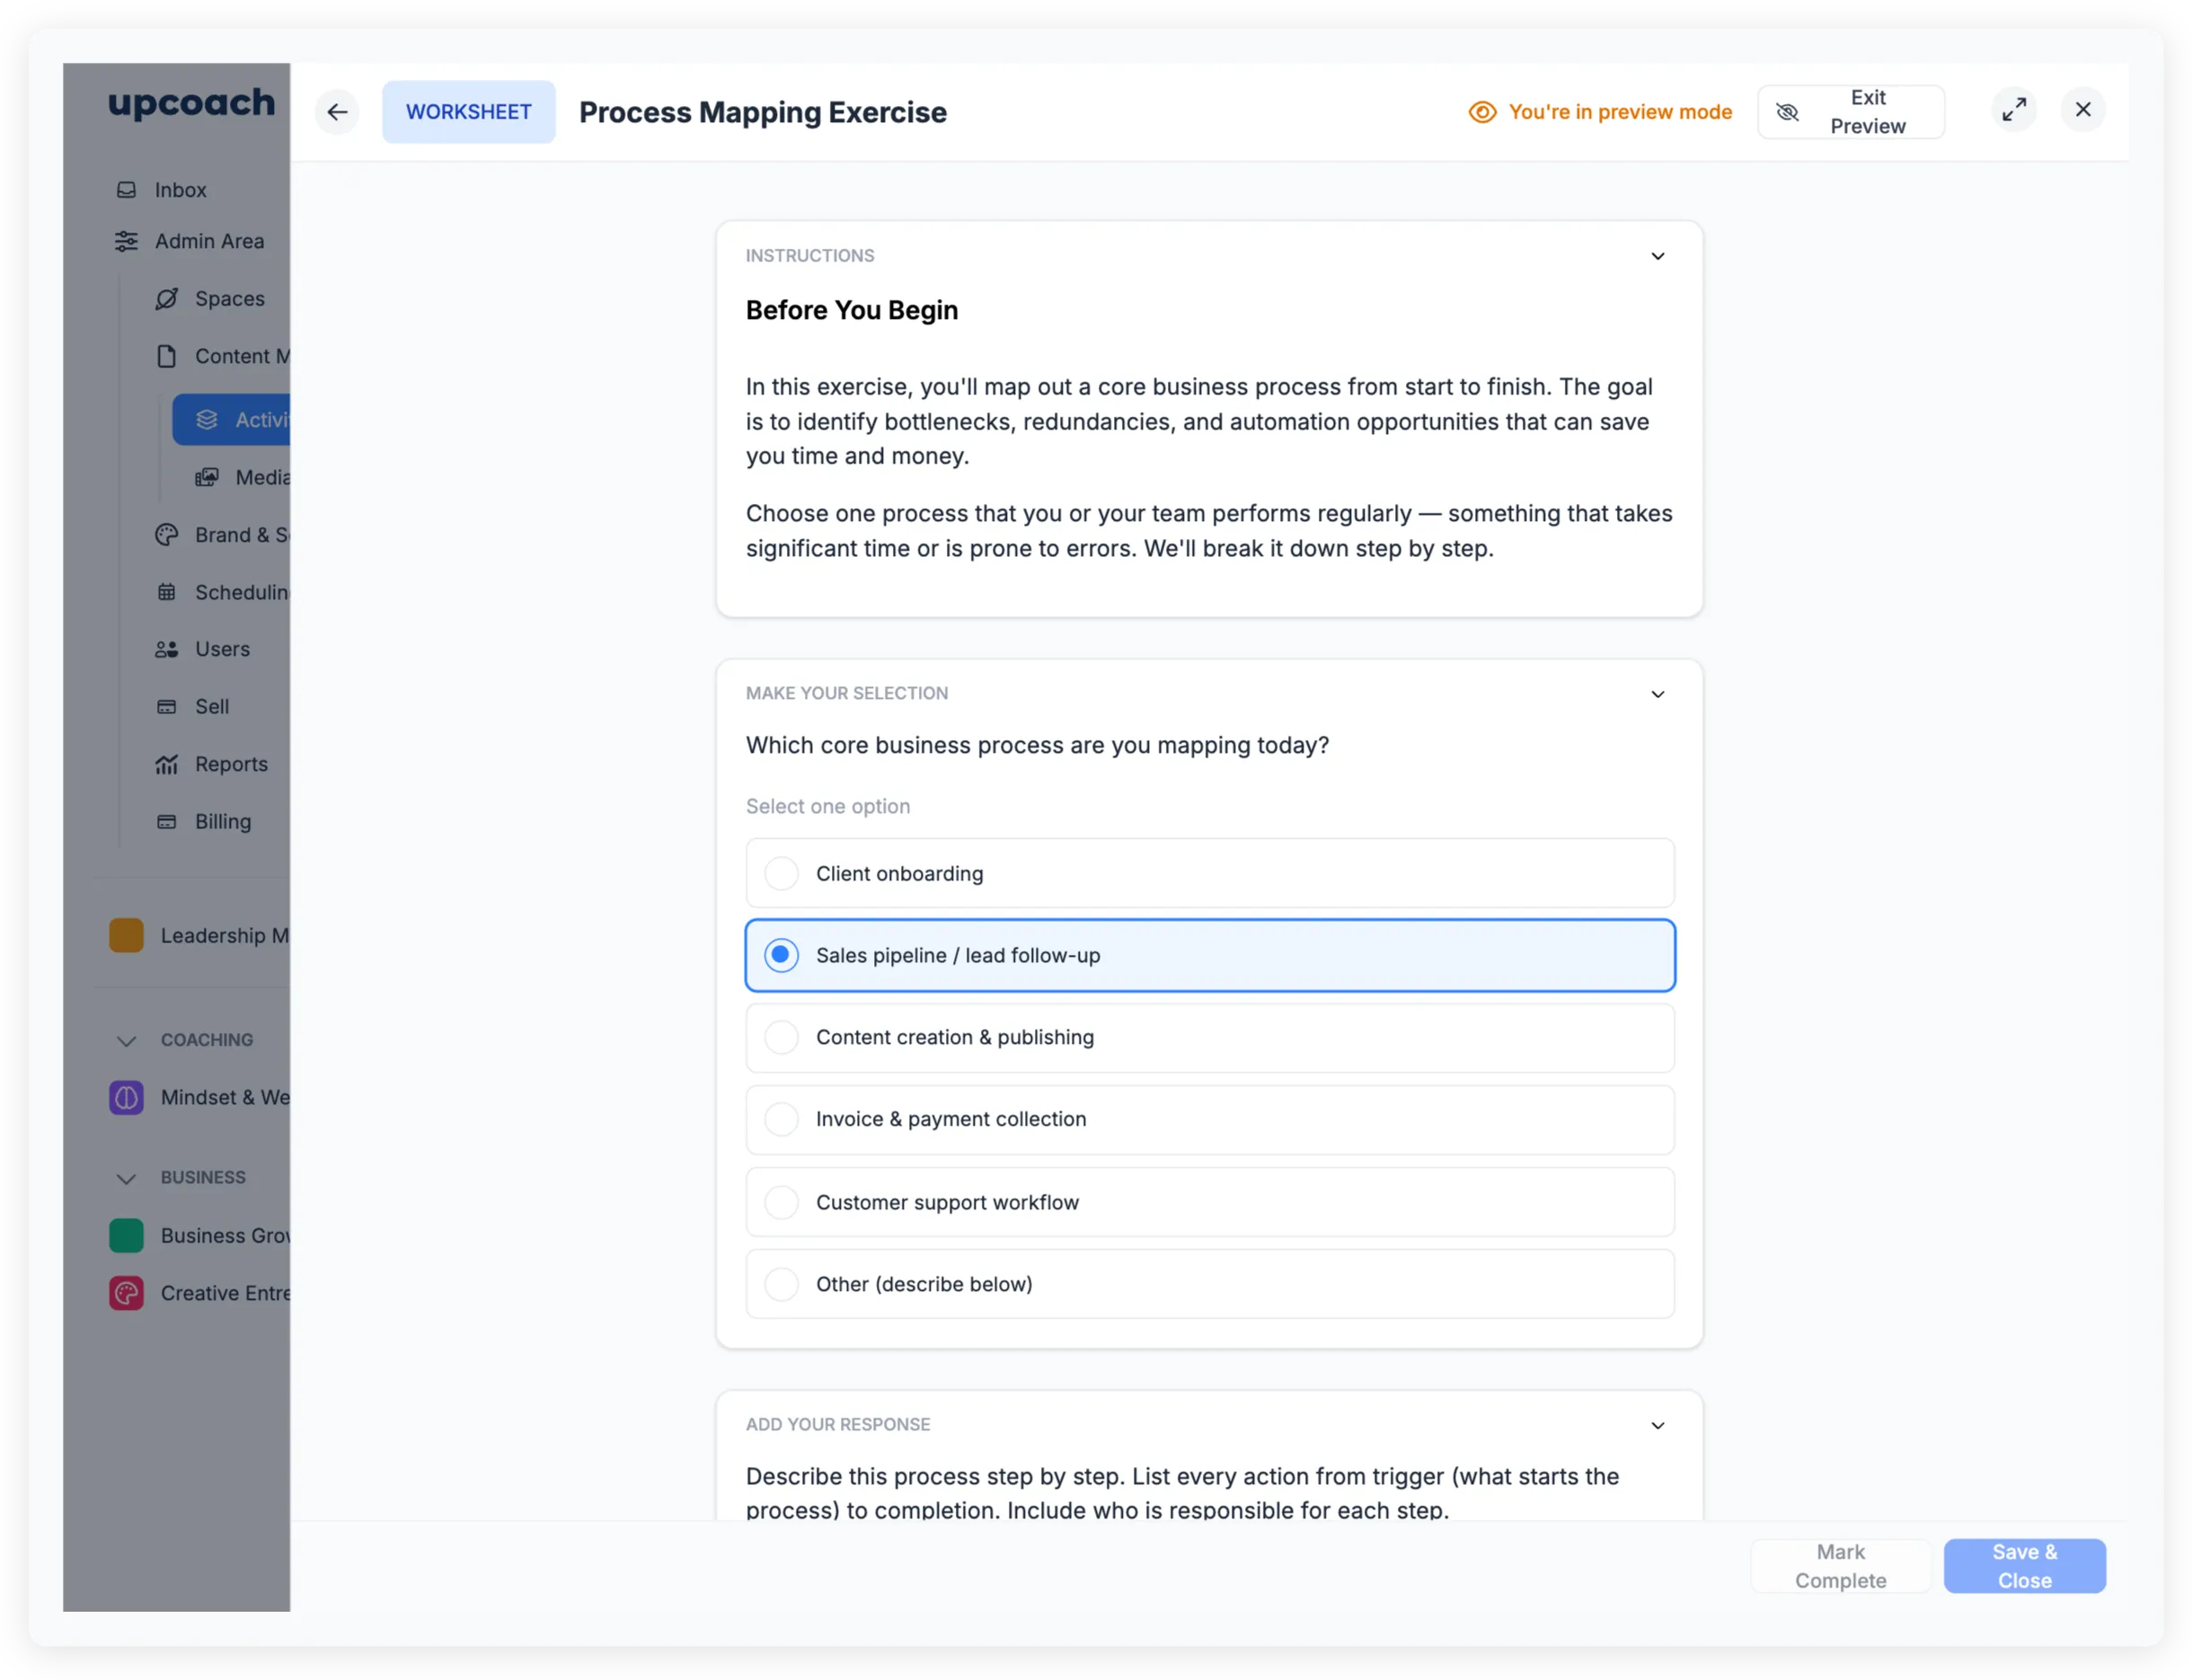
Preview your worksheet
Click Preview at the top of the editor to see the worksheet exactly as participants will. Click Exit Preview to return to editing.
Response visibility
Control who can see completed worksheet responses. Open the worksheet’s settings and find Client Response Visibility under the question “Who can view client responses?”
| Setting | Who sees responses |
|---|---|
| Only admins | Only program admins can view responses |
| All space members (default) | Everyone in the program can see each other’s responses |
When set to All space members, participants see a notice: “All Members will see your responses.”
How participants experience worksheets
Participants work through each question in order. Responses save automatically — there’s no submit button for individual questions. A progress bar at the top shows how much of the worksheet is filled in.
Once all fields are complete, participants click Mark Complete to finish. After completing, they can still view their responses and choose Mark as Incomplete from the dropdown if they need to make changes.
Activity states
Participants see different prompts depending on their progress:
| State | Card title | Button |
|---|---|---|
| Not started | Start Activity | Start |
| In progress | Resume Activity | Resume |
| All fields filled | Ready to Complete | Review Responses and Mark Complete |
| Completed | Activity Completed | View Your Responses |
View worksheet responses
Open the worksheet’s response panel to see three tabs:
Overview
Summary cards show Unique Views, In-Progress, and Completed counts, followed by a Recent table with each participant’s progress and last update date.
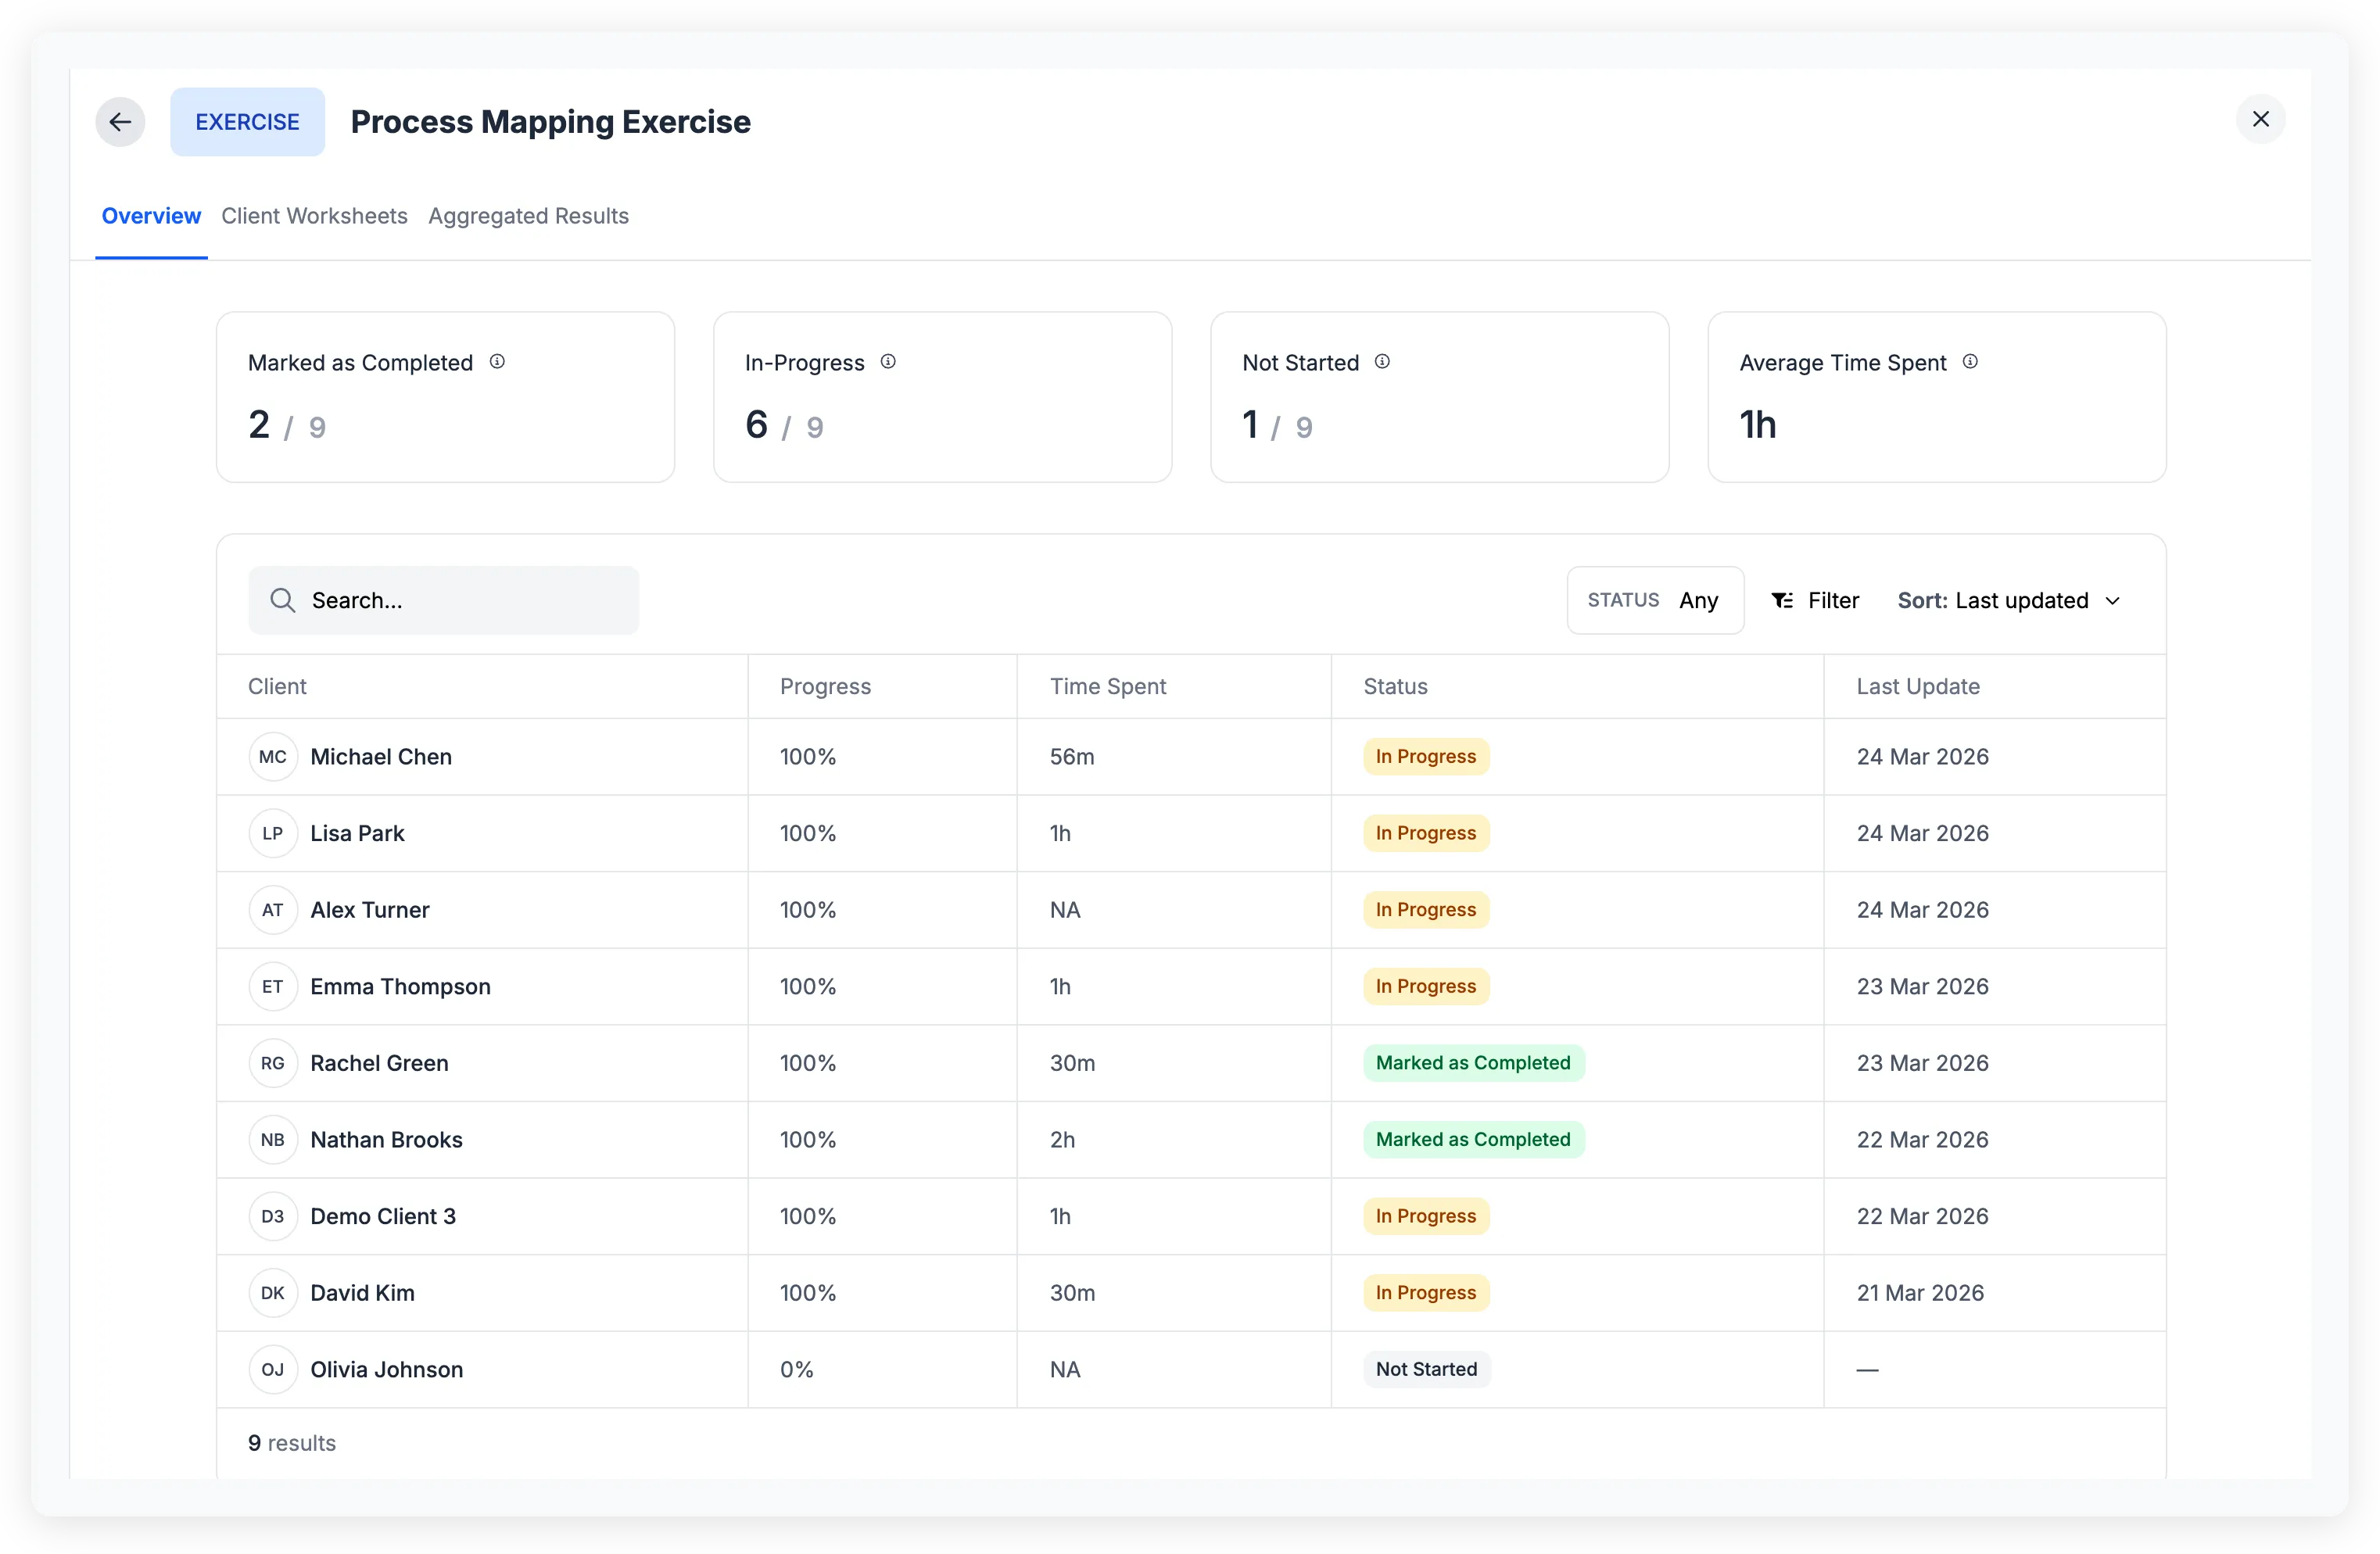
Click View Responses to open the full response list. This view shows four stat cards:
- Marked as Completed — Participants who clicked Mark Complete
- In-Progress — Participants who started at least one field
- Not Started — Participants with no answered fields
- Average Time Spent — Average active time across participants with responses
You can filter by status, sort by name, last updated, status, or time spent, and search by participant name.
Client Worksheets
Browse individual responses. A searchable sidebar lists every participant with a status badge:
- Marked as Completed (green)
- In Progress (amber)
- Not Started (gray)
Click a participant to see their full worksheet in read-only mode.
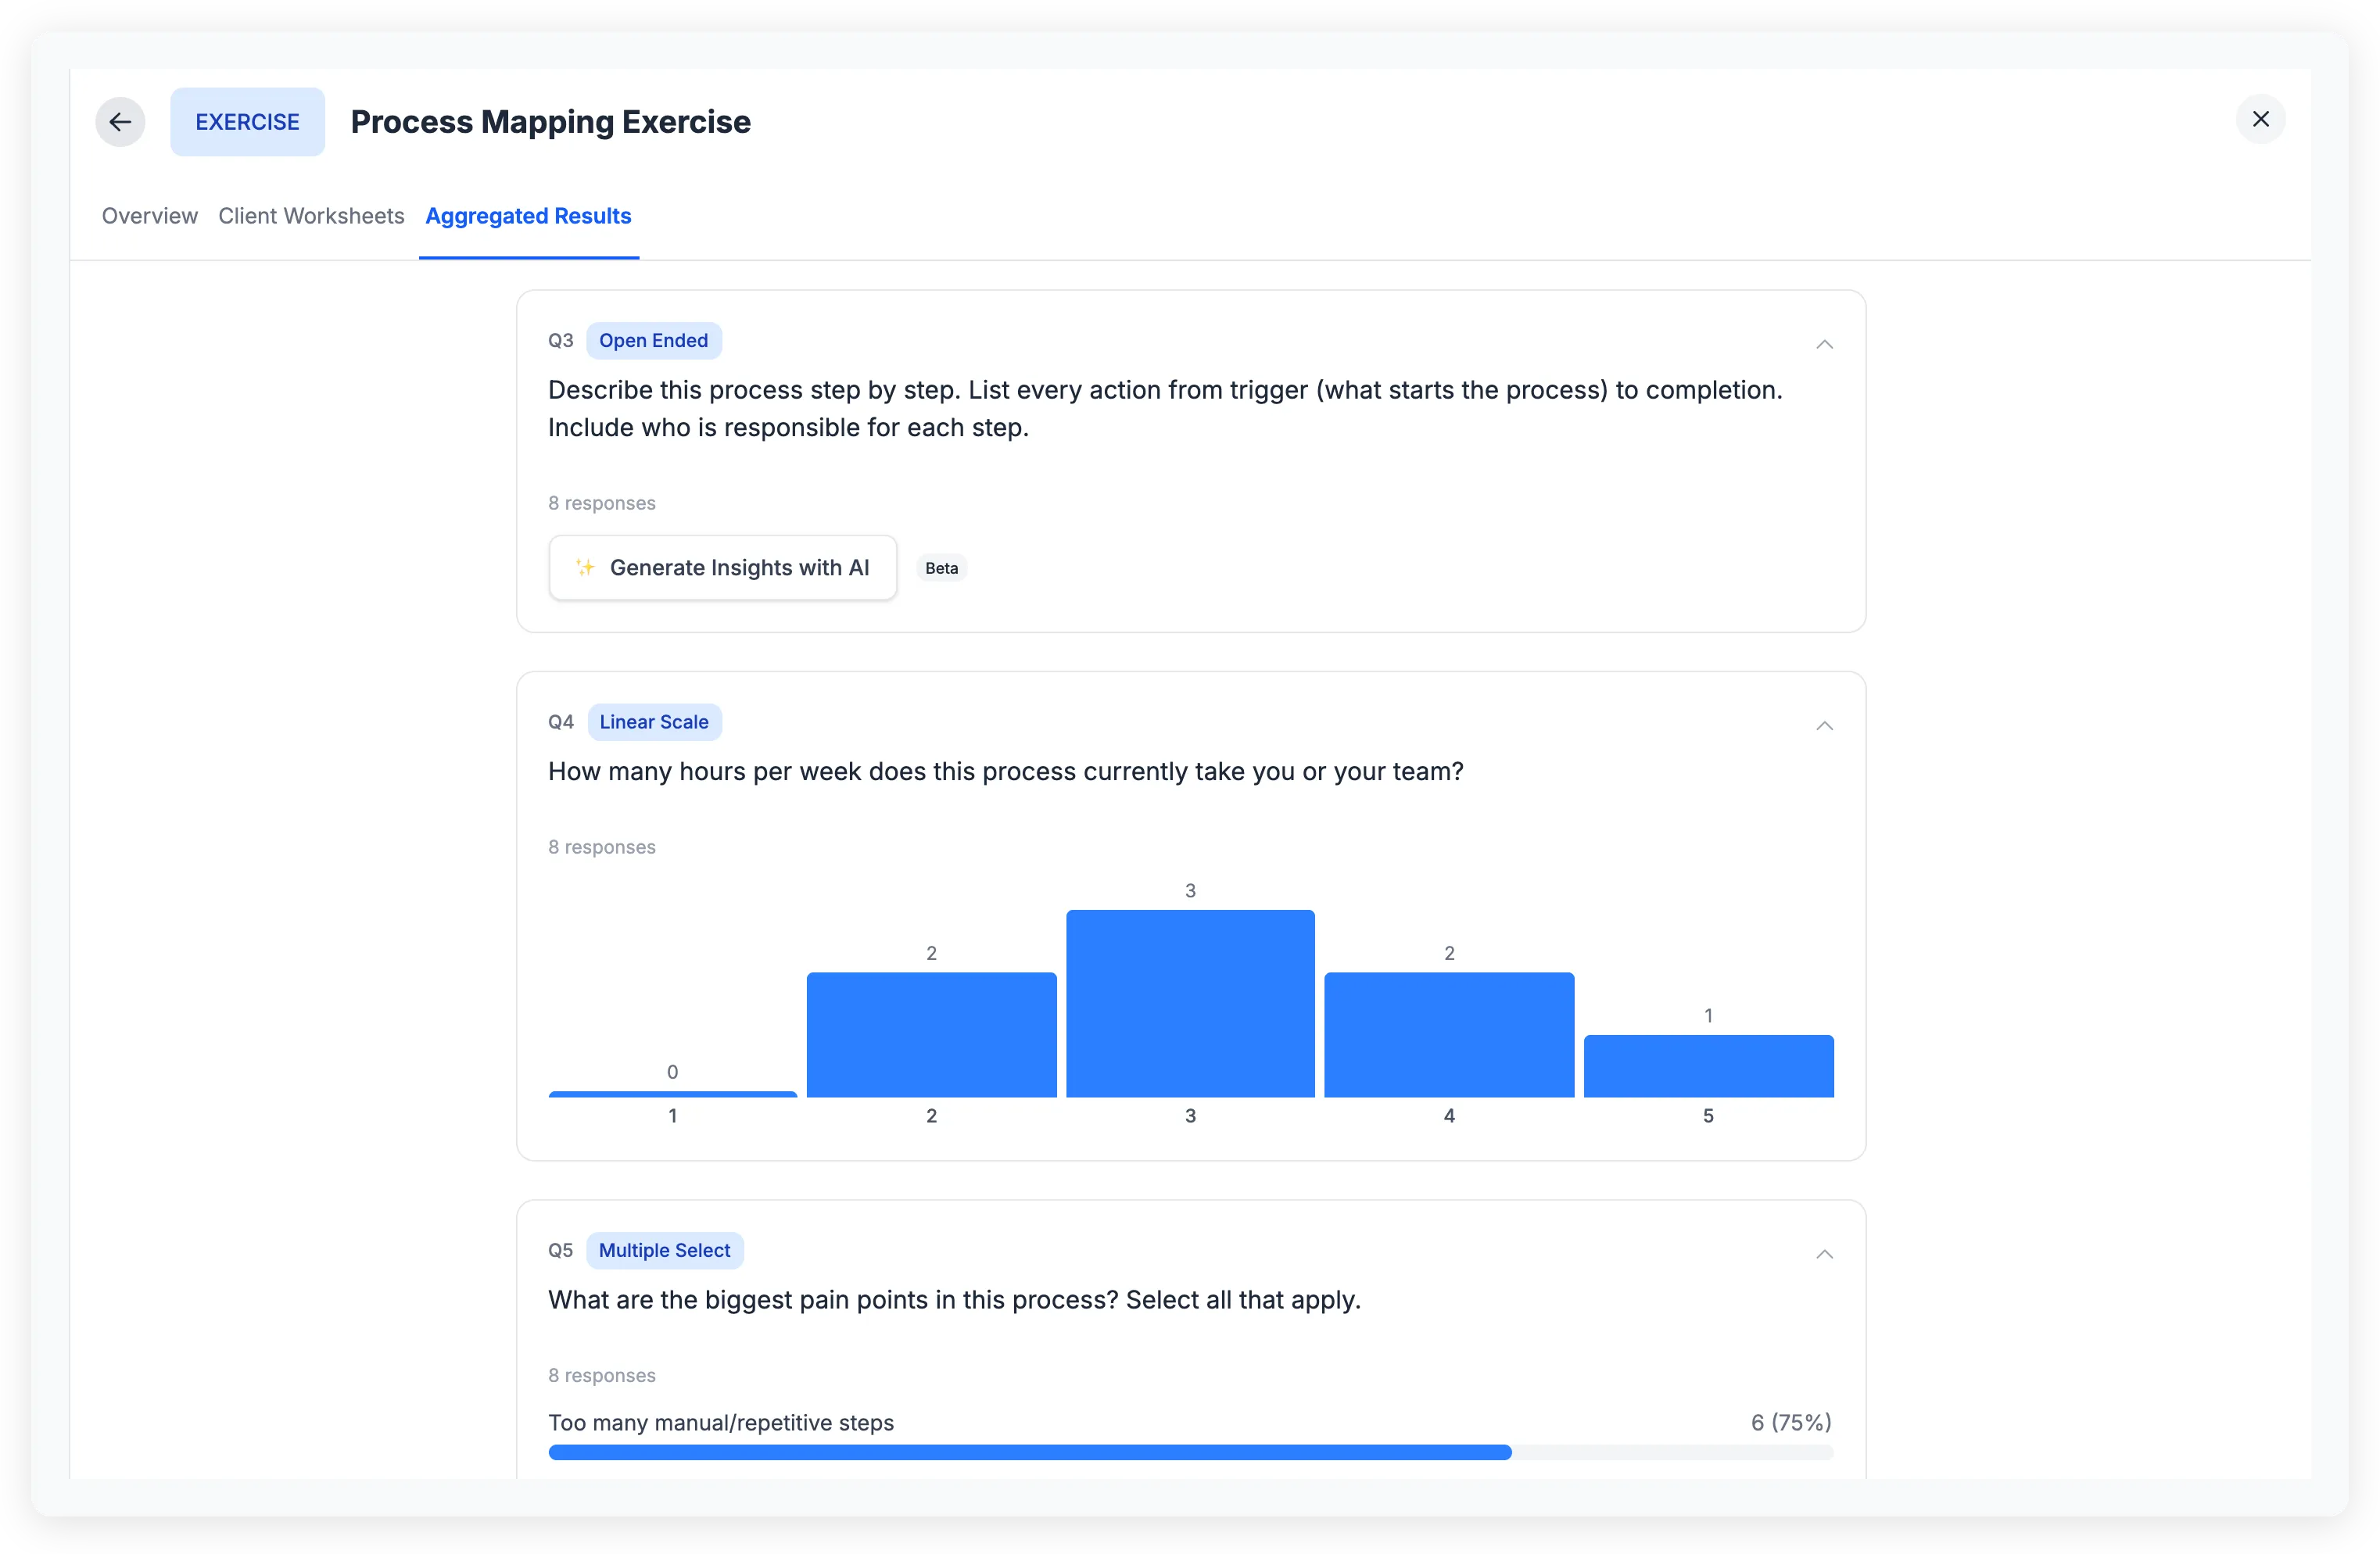
Aggregated Results
See response patterns across all participants, broken down by question:
- Single select and multiple select — Bar chart showing count and percentage for each option
- Linear scale — Bar chart showing the distribution across scale points
- Ranking — Average rank per option
- Wheel — Average score per category
- Open ended — Respondent count with AI-generated insights (available with 2 or more responses)
Each question appears in a collapsible card labeled with the question number (Q1, Q2, etc.) and a badge showing the question type.
When to use worksheets
Worksheets work well for:
- Intake forms — Gather information from participants when they join a program
- Self-assessments — Use wheels or linear scales to capture where participants stand today
- Reflection exercises — Open-ended questions for post-session or end-of-module responses
- Framework applications — Use canvases for structured templates (SWOT analysis, goal-setting grids, business model canvases)
- Agreements and sign-offs — Signature questions for commitments or contracts
- Pre/post comparisons — Place similar worksheets at different program stages to show growth
For recurring responses collected over time, use a check-in instead. For simple action-item checklists, use a task list.